Price doesn’t tell
the whole story.
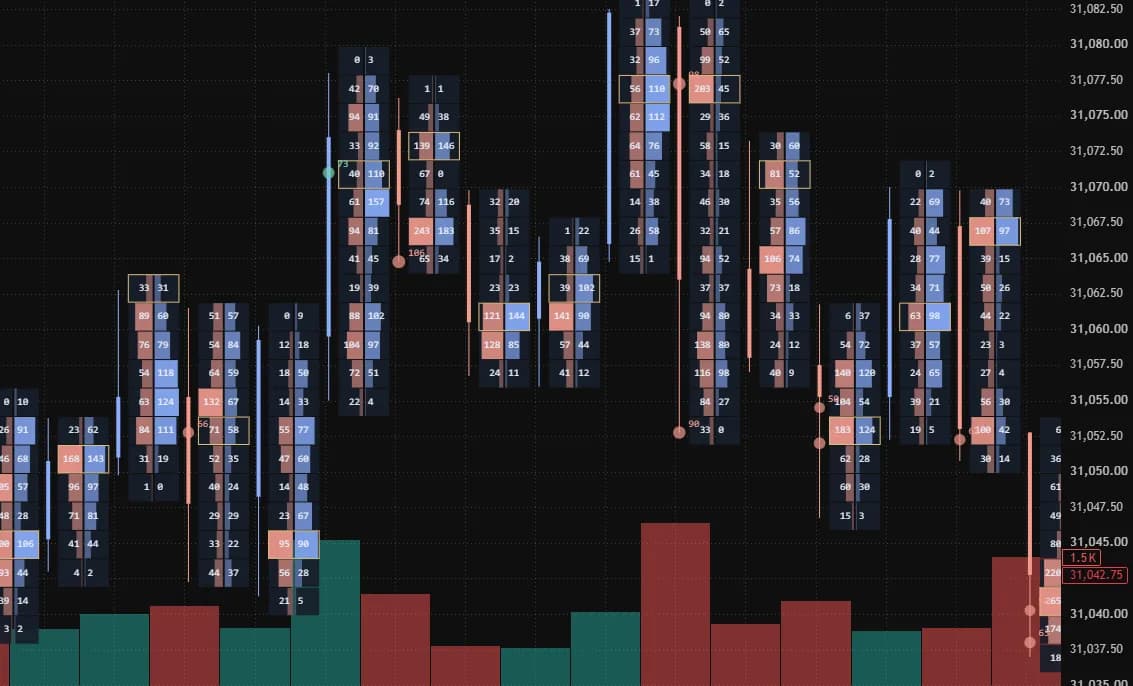
See the activity behind the price. Track large trades, buying and selling pressure, and the levels where volume concentrates.
Futures order flow indicators, computed for you and delivered to your tools through one API.
No credit card required. Includes a 10-minute delayed stream and 7 days of history.
THE MARKET MOVES. YOUR TOOLS FOLLOW.
We compute your indicators and push them over WebSocket. No polling: the stream comes to you.- ComputationServer-side, on every trade
- WebSocket APIPushed in real time
- Your toolsInstant update
- messages replayed
- 0
- Fathom Trades ≥ 20
- 0
- contracts traded
- 0
- demo
- real session, replayed
Real trades, read by Fathom.
Explore the order flow.
See what moves the market.
Where is volume concentrating? Which levels are being defended? When does pressure switch sides? Each indicator answers one precise question.
Fathom Trades
Size leaves a trace. Isolate aggressive orders above your threshold and see exactly where they hit the market.
Explore this indicatorLess noise.
More context.
Not every trade matters. Move the Fathom Trades threshold to keep only the biggest ones. The chart follows, and so does your API request.
- big trades kept
- —
- per hour (projected)
- —
- total contracts
- —
- data received (bytes)
- —
Buy Sell · size = volume · grey dots = below the threshold
{
  "t": "subscribe",
  "sub": "bt",
  "instrument": "NQ.front",
  "indicator": "big-trades",
  "params": {
    "minimum": 50
  },
  "mode": "confirmed",
  "from": "live"
}
Build your tools.
We compute the order flow.
Add order flow to your charts and research without building the indicator engine. Our API delivers computed results, while SDKs for TypeScript, Python, C# and Rust handle reconnection and resume the stream where it left off.
- wss Your indicators in real time, over a single connection
- REST The same computations on historical data
- NDJSON Compressed exports for your backtests
import { FathomChartsStream } from '@fathom-charts/sdk';
import type { BigTradesData } from './fathom-charts-types.js';

const stream = new FathomChartsStream({
  url: 'wss://stream.fathomcharts.com/v1',
  apiKey: process.env.FATHOM_CHARTS_API_KEY!,
});

const bigTrades = stream.subscribe<BigTradesData>({
  instrument: 'NQ.front',
  indicator: 'big-trades',
  params: { minimum: 30 },
  mode: 'confirmed',
});

for await (const event of bigTrades) {
  if (event.type === 'upsert') {
    console.log(event.data.side, event.data.volume, event.data.price);
  }
}async with FathomChartsStream(url="wss://stream.fathomcharts.com/v1", api_key=os.environ["FATHOM_CHARTS_API_KEY"]) as stream:
big_trades: Subscription[BigTradesData]
async with stream.subscribe(
instrument="NQ.front",
indicator="big-trades",
params={"minimum": 30},
mode="confirmed",
) as big_trades:
async for event in big_trades:
if isinstance(event, Upsert):
print(event.data["side"], event.data["volume"], event.data["price"])await using var stream = new FathomChartsStream(new StreamOptions
{
Url = "wss://stream.fathomcharts.com/v1",
ApiKey = Environment.GetEnvironmentVariable("FATHOM_CHARTS_API_KEY"),
});
var bigTrades = stream.Subscribe<BigTradesData>(new SubscribeOptions
{
Instrument = "NQ.front",
Indicator = IndicatorIds.BigTrades,
Params = new BigTradesParams { Minimum = 30 },
Mode = Mode.Confirmed,
});
await foreach (var e in bigTrades)
{
if (e is Upsert<BigTradesData> upsert)
Console.WriteLine($"{upsert.Data.Side} {upsert.Data.Volume} {upsert.Data.Price}");
}let stream = FathomChartsStream::builder("wss://stream.fathomcharts.com/v1")
.api_key(std::env::var("FATHOM_CHARTS_API_KEY").map_err(|_| "FATHOM_CHARTS_API_KEY is not set")?)
.build()?;
let mut big_trades = stream.subscribe::<BigTradesData>(
SubscribeOptions::new("NQ.front", "big-trades")
.params(json!({ "minimum": 30 }))
.mode(Mode::Confirmed),
)?;
while let Some(event) = big_trades.next().await {
if let StreamEvent::Upsert(upsert) = event? {
println!("{:?} {} {}", upsert.data.side, upsert.data.volume, upsert.data.price);
}
}npx -y wscat -c wss://stream.fathomcharts.com/v1 -H "Authorization: Bearer $FATHOM_CHARTS_API_KEY"
> {"t":"subscribe","sub":"bt","instrument":"NQ.front","indicator":"big-trades","params":{"minimum":30},"mode":"confirmed","from":"live"}
< {"sub":"bt","t":"subscribed","topic":"368bf15c2d34a77407c10b4f46b79e04","instrument":"NQZ6","tickSizeNanos":"250000000","engine":"82cbdecf93748dd5"}
< {"sub":"bt","t":"snapshot","cursor":"20720.110992.0","items":[…]}
< {"sub":"bt","t":"status","state":"live","lagMs":0}
< {"sub":"bt","cursor":"20720.111434.0","t":"upsert","id":"1790256600533489285:0","final":true,"ts":"1790256600535054015","data":{"side":"sell","volume":66,"trades":32,"start":"1790256600533489285","end":"1790256600533489285","first":122041,"last":122017,"price":122017,"vwap":122027.71212121213}}curl https://api.fathomcharts.com/v1/indicator-queries \
-H "Authorization: Bearer $FATHOM_CHARTS_API_KEY" \
-H "Content-Type: application/json" \
-d '{"instrument":"NQZ6","indicator":"big-trades","params":{"minimum":30},
"from":"1790256600000000000","to":"1790258100000000000"}'Already on TradingView?
Draw Fathom on your chart.
A Chrome extension draws Fathom indicators directly on your TradingView futures charts. No code: paste your API key, tick the indicators, open your chart.
- All 10 Fathom indicators, from the footprint to the opening range
- Follows your symbol, interval and scroll
- Real time with a Live plan, 10-minute delay on the free Sandbox
Start for free.
Go real time whenever you want.
Start with the free Sandbox, no credit card required. Add real-time streaming, historical data, or both when you’re ready. Save with yearly Live billing or the bundle.
Scroll the table to see all four plans
| YOUR ACCESS One engine. | 01SandboxFreeNo credit card needed Your first integration, no commitment. | 02LiveMonthly or yearly subscription Your indicators in real time, in your tools. | 03HistoricalOne-time purchase, lifetime access Backtest with the full available history, including future additions. | 04Live + HistoricalOne-time purchase: Historical for life and 12 months of Live Research and stream with one purchase: lifetime Historical access and 12 months of Live. |
|---|---|---|---|---|
| Create my free account | Subscribe to Live | Buy Historical | Buy the bundle | |
| WebSocket streamIndicators are pushed to you continuously over a WebSocket connection. When delayed, everything arrives that far behind the market. | 10-min delay | Real time | 10-min delay | Real time |
| Concurrent connectionsHow many WebSocket connections your account can keep open at the same time, across all your keys. One connection can carry many subscriptions. | 1 | 5 | 1 | 5 |
| Concurrent subscriptionsA subscription is one indicator followed on one instrument. This counts all your subscriptions active at the same time, across all your connections and keys. | 2 | 50 | 2 | 50 |
| Custom configurationsAn indicator used on an instrument with parameters other than its defaults on that ticker, for example Fathom Trades with a minimum volume other than the current default of its ticker. Each combination counts once, however many subscriptions use it. | 1 | 25 | 1 | 25 |
| Historical APIHow far back you can go: REST queries, exports and subscriptions that start in the past. The full history goes back to around 2011, depending on the instrument, and includes every history added later. | Last 7 days | Last 7 days, unlimited | Full available history | Full available history |
| Compute budget per monthWhat you can spend on history each month: queries, exports and subscriptions that start in the past. Each trade in the requested range costs 1 compute unit, whatever the indicator; a full NQ trading day holds roughly 300,000 to 1 million trades. Real time costs nothing, and with Live, ranges that start within the last 7 days cost nothing either. | 50 million compute units | Unlimited on the last 7 days | 20 billion compute units | 20 billion compute units |
| Exports per monthHow much your exports can download each month, measured compressed, as you receive it. It comes on top of the compute budget: an export uses both. | Not included | Not included | 20 GiB | 20 GiB |
| REST requests per minuteCalls to the REST API per minute, across all the keys of your account. Beyond that, requests are refused with 429. | 60 | 300 | 1,200 | 1,200 |
Before you
get started.
Do I need to write code to use Fathom?
Fathom is an API for integrating computed order flow into your own tools. You need to write code or use an integration built for Fathom. Our SDKs for TypeScript, Python, C# and Rust help you get started; the charts on this page demonstrate the indicators.
Where does the data come from?
Our indicators are computed from market trades. If the source is delayed or down, the stream tells you: no data is ever made up or filled in.
How can I try it for free?
Create an account with your email address: you start on the Sandbox, no credit card needed. 10-minute delayed stream, 7 days of history, the same computations as in real time. When you move to Live, the same keys switch to real time: your code stays the same.
How does payment work?
Choose a monthly or yearly Live subscription, a one-time Historical purchase with lifetime access (for as long as we operate the historical API), or a bundle with lifetime Historical access and 12 months of Live. Prices are in euros including tax in metropolitan France, the rest of Europe and the French overseas territories that use the euro, in US dollars before tax elsewhere. Payment details are covered in Plans and billing.
Can I redistribute the live or historical data?
No. Live and historical data alike are derived from market data: they are for the account holder only, under the market data license terms included in our terms of use. Any distribution to third parties (public app, resale, display to your clients) requires a specific license agreement.
Does historical data match the real-time stream?
Yes, for the same parameters. Both use the same trades and the same computation engine, and we compare results field by field on real sessions. Default values are updated per ticker over time: pass your parameters explicitly to keep results identical. If a period is not covered, the API responds with NOT_COVERED instead of returning partial data.
Which instruments are covered?
The futures streamed by the service, listed with their tick size by GET /v1/instruments. An alias such as NQ.front follows the active contract and switches at rollover, announced by a reset message.
What if my app can't keep up with the live stream?
The API merges pending provisional updates and never drops a final result. If your app stays stuck, the connection is closed and you resume from the last cursor received. Thresholds and resumption are covered in the WebSocket protocol.
Does Fathom Charts place orders?
No. Fathom Charts provides indicators to feed your analysis: it does not connect to your broker, never places orders and gives no investment advice.
Look beyond
the candles.
Bring order flow into your own charts, research and backtests.
Start with the free Sandbox. Add real time when you’re ready.